Bitcoin’s Current Price Status and Key Levels
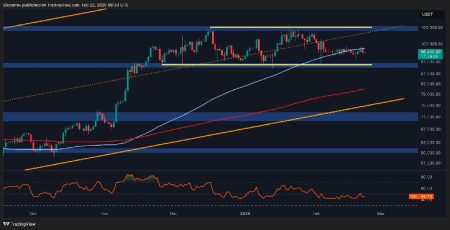
Bitcoin (BTC) has shown resilience in recent weeks, managing to climb above certain critical technical levels. As of the latest data, Bitcoin is trading at approximately $96,736. This price point is significant because it sits above the $95,000 support level, a crucial checkpoint that has historically served as a foundation for Bitcoin’s price stability. Additionally, Bitcoin has also gained momentum by rising above the moving average lines, which are essential indicators used by traders and analysts to gauge the strength and direction of a trend.
However, despite this upward movement, Bitcoin is encountering resistance at the 50-day Simple Moving Average (SMA). The 50-day SMA is a widely followed indicator that helps determine the overall health of a trend. Currently, Bitcoin is struggling to break above this barrier, which is acting as a ceiling and preventing further upward momentum. If Bitcoin can successfully breach this 50-day SMA, it could signal a shift in the market’s sentiment and potentially pave the way for higher prices in the near term.
Bitcoin’s Long-Term Forecast: Bearish Sentiment Dominates
Looking ahead, the long-term outlook for Bitcoin remains bearish, according to the analysis by Coinidol.com. This bearish sentiment is largely influenced by Bitcoin’s current position relative to the 50-day SMA. While Bitcoin has managed to stay above the 21-day SMA, which is acting as a support level, its inability to sustain a break above the 50-day SMA suggests that the bears are still in control of the market.
There are two primary scenarios that could unfold based on Bitcoin’s performance in the coming days. The first scenario is that Bitcoin manages to break above the 50-day SMA. If this happens, Bitcoin could surge to a high of $102,390, indicating a potential short-term rally. However, the second and more concerning scenario is that Bitcoin fails to overcome the 50-day SMA resistance. In this case, Bitcoin could be confined to a trading range between the moving average lines, a situation that would likely lead to increased volatility and uncertainty in the market.
Bitcoin’s Price Indicators and Analysis
The analysis of Bitcoin’s price indicators reveals some interesting insights. Before the recent breakout, Bitcoin was trapped between the moving average lines, oscillating without a clear direction. This period of consolidation was marked by sideways trading, as Bitcoin struggled to find the momentum needed to break out of this range. However, once Bitcoin broke through these moving average lines, it quickly rebounded, demonstrating its resilience and the underlying strength of the market.
One key indicator that is currently being closely monitored is the 50-day SMA. If Bitcoin can maintain its position above this level, it could signal the start of a new upward trend. The price bars on the chart are currently above the moving average lines on the upside, a bullish sign that suggests Bitcoin is in recovery mode. Moreover, the fact that Bitcoin has resumed its uptrend after a period of consolidation is a positive development that could attract more buyers into the market.
Key Technical Indicators and Levels to Watch
From a technical standpoint, there are several key levels and indicators that traders and investors should be paying close attention to. These levels can provide valuable insights into Bitcoin’s potential future price movements and help identify areas of support and resistance.
On the supply side, the key supply zones are located at $108,000, $109,000, and $110,000. These levels represent significant resistance points that Bitcoin would need to overcome if it is to continue its upward trajectory. Conversely, the key demand zones are at $90,000, $80,000, and $70,000. These levels are critical because they represent potential support areas where buying interest may increase, helping to stabilize or drive up Bitcoin’s price.
What’s Next for Bitcoin?
The next move for Bitcoin will largely depend on its ability to sustain its current momentum and break above the 50-day SMA. If the bulls can maintain their grip on the market and drive Bitcoin above this resistance level, it could trigger a fresh wave of buying, propelling Bitcoin to new heights. Specifically, a successful break above the 50-day SMA could see Bitcoin reaching a high of $102,390, as previously mentioned.
However, if Bitcoin fails to overcome this critical resistance level, it could lead to a period of range-bound trading. In this scenario, Bitcoin would likely oscillate between the moving average lines, unable to establish a clear direction. This would result in increased volatility, as traders attempt to capitalize on the fluctuating prices. Additionally, if the bears manage to gain the upper hand and push Bitcoin below the 21-day SMA, it could trigger a sharp decline, potentially sending Bitcoin back down to its previous range of $94,000 or lower.
Conclusion and Disclaimer
In conclusion, Bitcoin’s price action is at a critical juncture, with the outcome likely hinging on its performance relative to the 50-day SMA. While the recent breakout above the moving average lines and the $95,000 support level is a positive sign, the failure to breach the 50-day SMA leaves the market vulnerable to a pullback. Traders and investors should remain vigilant, closely monitoring Bitcoin’s price movements and staying attuned to any changes in market sentiment or technical indicators.
It is important to remember that this analysis and forecast are based on the personal opinions of the author and should not be taken as a recommendation to buy or sell cryptocurrency. Readers are advised to conduct their own research and consider their own risk tolerance before making any investment decisions. Cryptocurrency markets are highly volatile, and prices can fluctuate rapidly, making them a high-risk investment. Always remember that past performance is not indicative of future results, and never invest more than you can afford to lose.


